The command-line version of Ontologizer can be used for batch processing or pipelines. Most general users will prefer the Java WebStart version, though.
Installation
If you want to use the command-line version, you need just need to download the Ontologizer.jar file.
Installation under Debian
Users that run Debian or a Debian-based distribution are recommended to install the command-line version of Ontologizer from Ontologizer’s Debian repository hosted at Bintray. To do so, first import Bintray’s public key:
 $ su
 $ apt-key adv --keyserver hkp://keyserver.ubuntu.com:80 --recv-keys 379CE192D401AB61
Then add the Ontologizer repository to your sources.list file and update the package database like this:
 $ echo deb [arch=all] https://dl.bintray.com/ontologizer/deb unstable main >>/etc/apt/sources.list.d/ontologizer.list
 $ apt-get update
You are now ready to install Ontologizer:
 $ apt-get install ontologizer-cli
 $ exit
You may need to install the Debian package apt-transport-https prior these steps in order to allow downloading packages
via the https protocol.
Help
Ontologizer is a Java-Application and if you downloaded the Ontologizer.jar jar file, you need to start it via the java command.
But if you installed it via the Debian repository, you can invoke it more conveniently via the ontologizer wrapper script.
All possible command arguments along with a short description can be viewed via the --help argument. E.g.
$ java -jar Ontologizer.jar --help
or
$ ontologizer --help
will produce following output:
usage: java -jar Ontologizer.jar [-a <file>] [-c <arg>] [-d <[thrsh[,id]|id]>]
       [-f <arg>] [-g <file>] [-h] [-i] [-m <arg>] [-n] [-o <arg>] [-p <file>]
       [-r <arg>] [-s <path>] [-t <arg>] [-v]
Analyze High-Throughput Biological Data Using Gene Ontology
 -a,--association <file>      File containing associations from genes to GO
                              terms. Required
 -c,--calculation <arg>       Specifies the calculation method to use. Possible
                              values are: "MGSA", "Parent-Child-Intersection",
                              "Parent-Child-Union" (default), "Term-For-Term",
                              "Topology-Elim", "Topology-Weighted"
 -d,--dot <[thrsh[,id]|id]>   For every study set analysis write out an
                              additional .dot file (GraphViz) containing the
                              graph that is induced by interesting nodes. The
                              optional argument thrsh must be in range between 0
                              and 1 and it specifies the threshold used to
                              identify interesting nodes (defaults to 0.05). The
                              GO term identifier id restricts the output to the
                              subgraph originating at id.
 -f,--filter <arg>            Filter the gene names by appling rules in a given
                              file (currently only mapping supported).
 -g,--go <file>               File containig GO terminology and structure (.obo
                              format). Required
 -h,--help                    Shows this help
 -i,--ignore                  Ignore genes to which no association exist within
                              the calculation.
 -m,--mtc <arg>               Specifies the MTC method to use. Possible values
                              are: "Benjamini-Hochberg", "Benjamini-Yekutieli",
                              "Bonferroni", "Bonferroni-Holm", "None" (default),
                              "Westfall-Young-Single-Step",
                              "Westfall-Young-Step-Down"
 -n,--annotation              Create an additional file per study set which
                              contains the annotations.
 -o,--outdir <arg>            Specfies the directory in which the results will
                              be placed.
 -p,--population <file>       File containing genes within the population.
                              Required
 -r,--resamplingsteps <arg>   Specifies the number of steps used in resampling
                              based MTCs
 -s,--studyset <path>         Path to a file of a study set or to a directory
                              containing study set files. Required
 -t,--sizetolerance <arg>     Specifies the percentage at which the actual study
                              set size and the size of the resampled study sets
                              are allowed to differ
 -v,--version                 Shows version information and exits
In order to do something useful, Ontologizer must be started with several arguments (as indicated with “Required” within the output above).
Required Arguments
First, you are required to specify the -g (or --go) option. This defines the path to a file which contains the GO terminology and structure. Ontologizer is able to parse files in the OBO format. Such are available directly at the GO Website from http://geneontology.org/page/download-ontology.
Second, you are required to specify the -a option which defines the mapping of gene names to GO terms. The GO Website provides association files for a variety of organisms, as well. See http://geneontology.org/page/download-annotations.
Third, you must specify a population file with the -p option. This file contains all gene names (one per line) of the population set, e.g. the names of the genes of your microarray.
Last, you need to specify the path to your study set(s) with the -s option. This can either be a single file for a single study set or a directory, in which case all files (ending with *.txt) are considered as separate study sets. As for the population file, one line represents only a single gene name.
When started with these four parameters only, the output of Ontologizer’s calculation is written to a basic ascii table file into the same directory where the study files are located. The table’s filename is derived from the name of the study set in question but prepended with “table-” string.
Optional Arguments
Using the -d option, you can instruct Ontologizer to create a graphical output of the results. For every study set, a file (name is prepended with “view-”) is written which can be read by the graphviz dot tool to produce a viewable graphics file. In this file, terms are depicted by nodes and their hierarchical relations are depicted by edges. Because the GO DAG contains a huge amount of terms, the graph is constructed only for significant terms and their predecessors (up to the source) and those significant terms are highligthed. Which terms are considered as significant is influenced by their p-values and the significance threshold. This threshold is specified as a parameter to the -d argument. It must be a valid floating point value ranging from 0 to 0.5. For example use -d 0.05 to define those terms as significant whose p-value falls below 0.05.
In addition, you can specify a GO Term ID, after the floating-point value (separated by “,”). In this case only the subgraph starting at this term is written. For example use -d 0.05,8152 to get only a graph with the term id GO:0008152 (metabolism) and its successors within the subgraph emanating from GO:0008152 such that all significantly overrepresented terms are included in the graph.
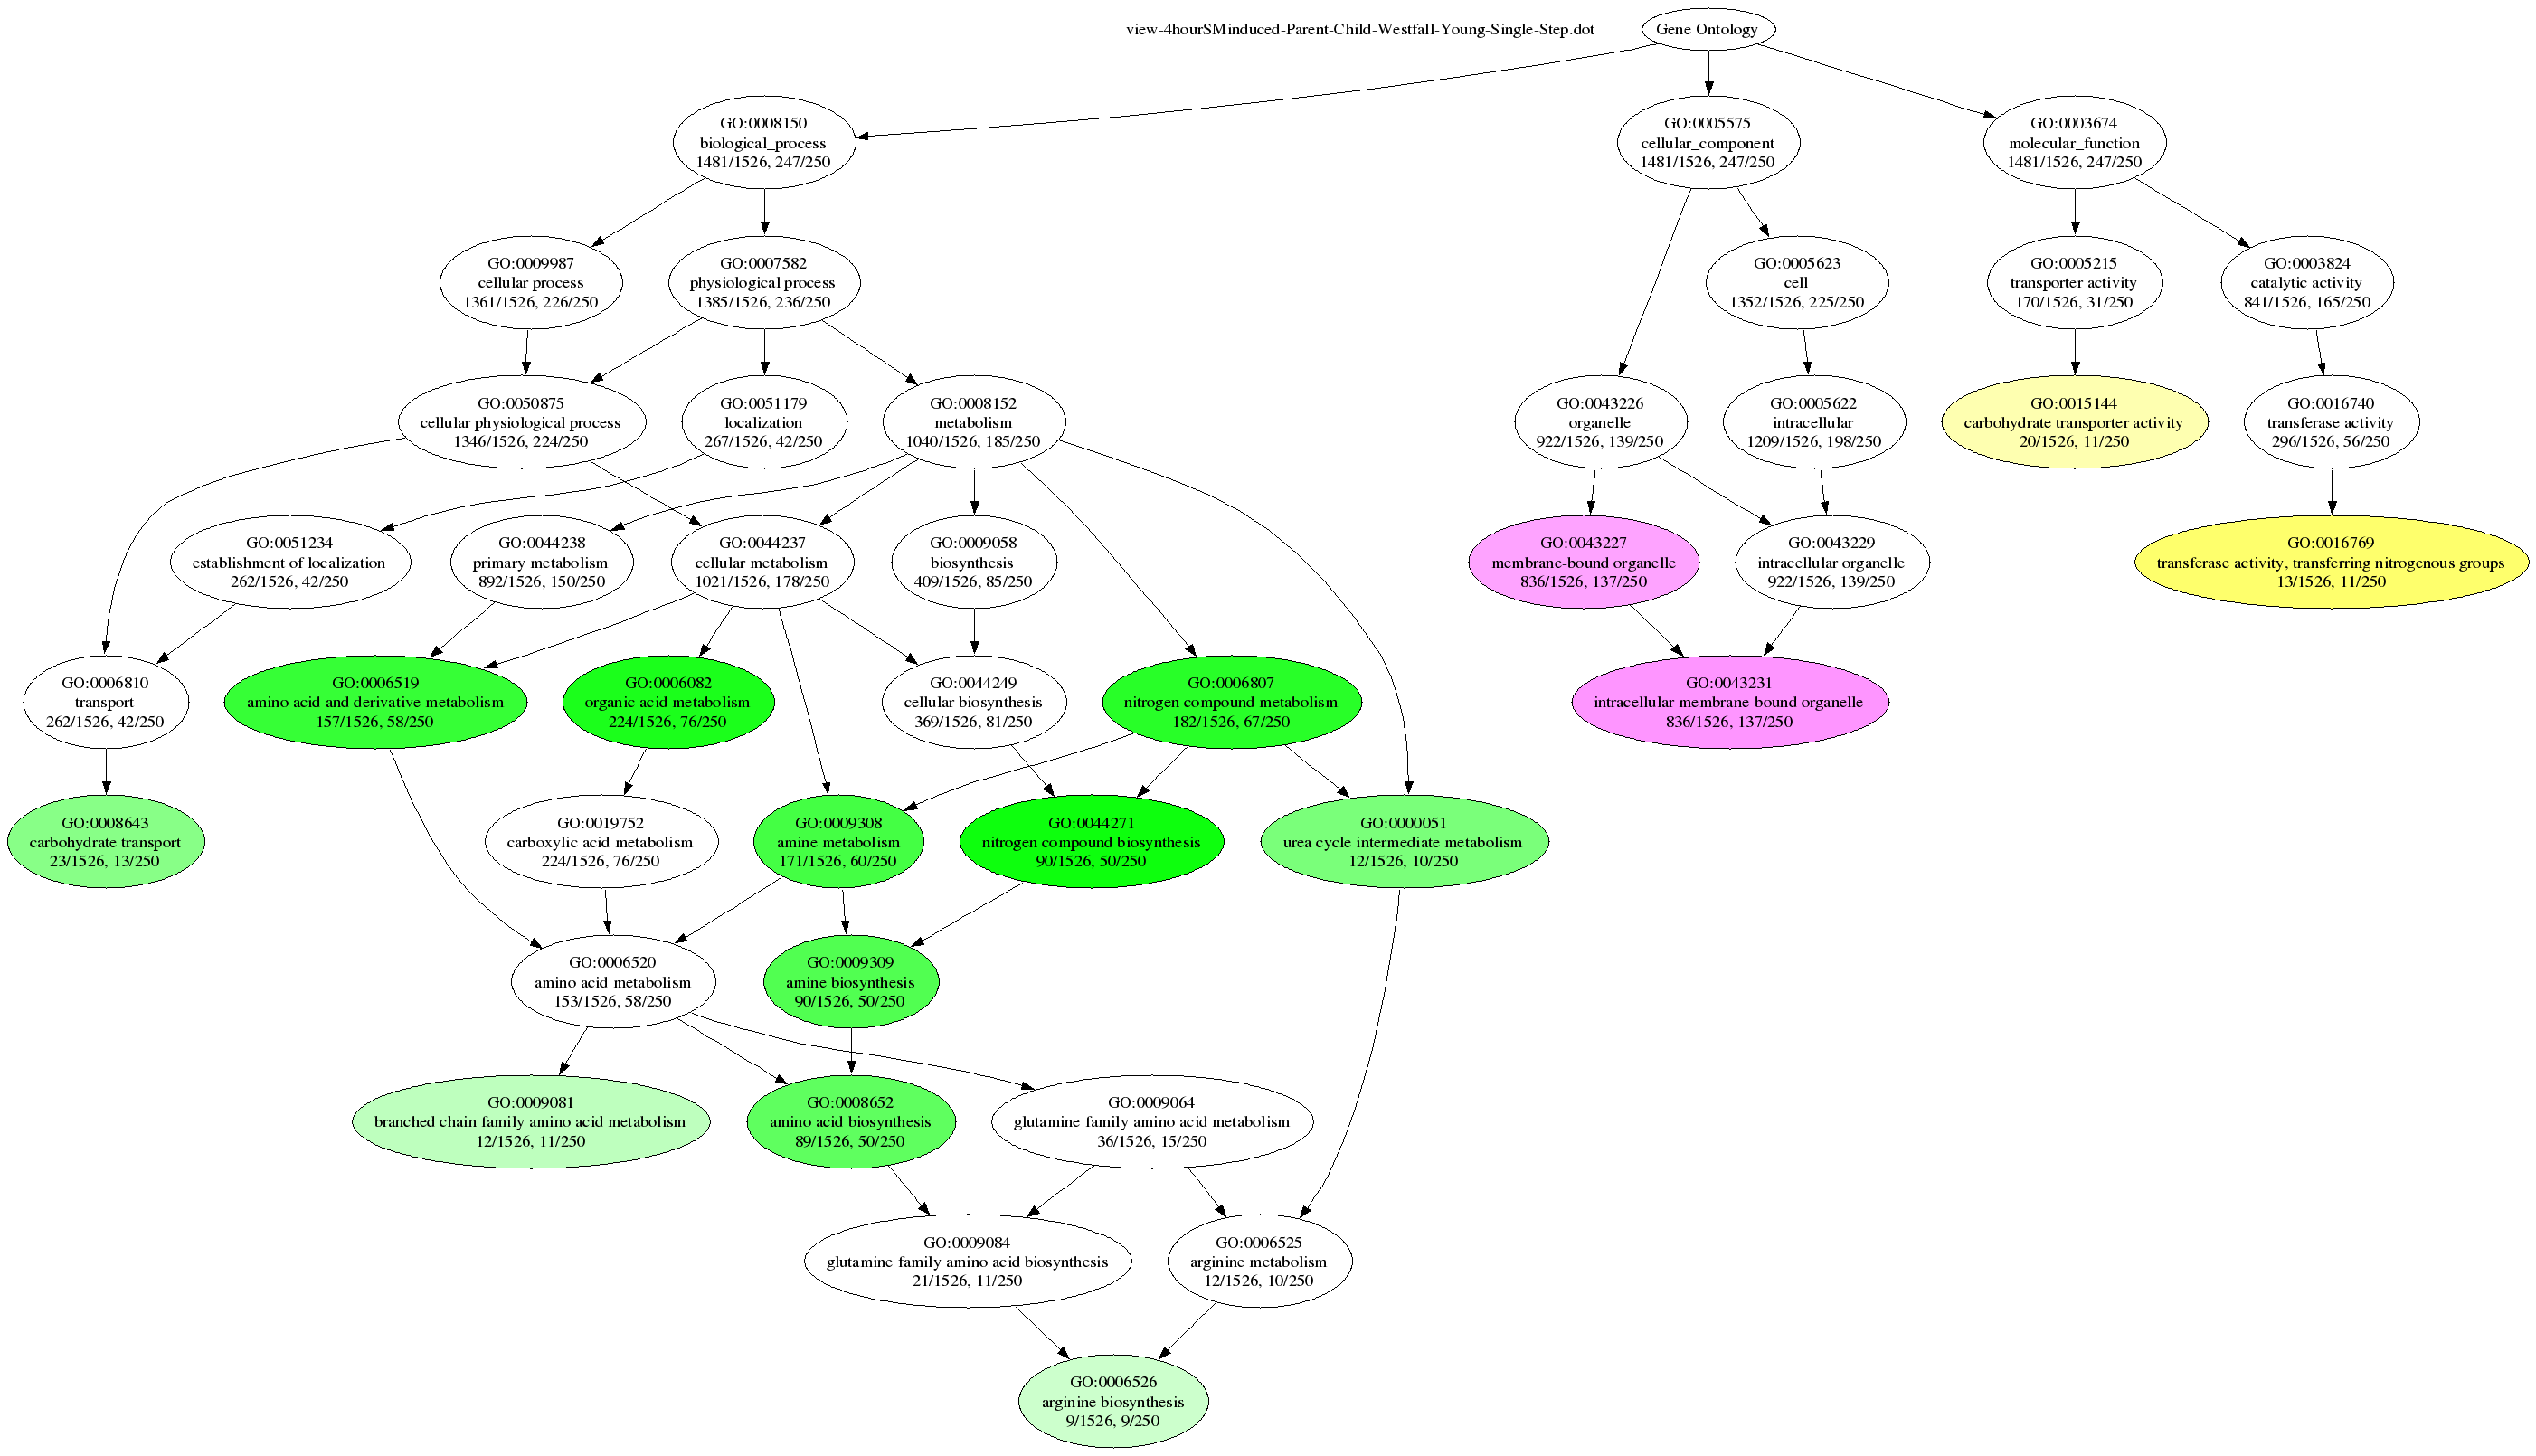
Some sample datasets and population sets can be downloaded from this page. To perform parent-child analysis using Westphal-Young MTC on the Yeast data set from the tutorial page and display the results using dot, enter the following command:
$ java -jar Ontologizer.jar -a gene_association.sgd -g gene_ontology.obo -s study/4hourSMinduced.txt -p population.txt -c Parent-Child-Union -m Westfall-Young-Single-Step -d 0.05 -r 1000
The corresponding files must be in the current directory (or their full path must be indicated). To create a PNG image with the result, enter
dot -Tpng view-4hourSMinduced-Parent-Child-Westfall-Young-Single-Step.dot -oExample.png
The corresponding graphic should look something like this:
Obtaining Graphviz
Graphviz is a Open Source project which provides tools for layouting and depicting graphs. Hereby, graph references to mathematical entities which consists of nodes and edges.
A installed Graphviz system is a requirement for Ontologizer’s facility to visualize the results of an enrichment analysis. More precisely, the tool named dot is invoked which performs the layouting step of the graph.
Windows users can obtain the installation package of Graphviz following the Download link of www.graphviz.org. On this site, you also can find the latest source packages which can be used, for instance by Linux, users to compile the package. Linux Distributions such as Debian provide binary packages for Graphviz as well. This allows a straithforward installation of Graphviz.
Note that in general, the standard installtion (of the Windows and Linux installation) is perfectly suited for Ontologizer. If however, for any reason, the dot exectutable is not in the command path, you have to tell Ontologizer explicitly where this command can be found by entering the full path within the Preferences window, which can be obtained via the Window > Preferences…. menu entry.